
Phases of a Game Show, Part 2
Something in our game show broke and now we have a new phase transition!

In a previous post, we discussed a phase transition that occurred in the piping above you on a game show. In the scenario, you are led on stage in front of a large audience. After a brief time, the audience votes on how “likeable” you are. The catch is that it doesn’t simply tally the votes, but turns spigots on a lattice of piping above your head. Water is then released and if enough people like you, it closes off the passage, keeping you dry. This exciting game show1 was described in that post:
Each “like” turns a spigot off, stopping water from flowing through one pipe in a grid overhead. Once voting ends, water is dumped into the system. If it can find a path to the bottom, you get soaked. [Emphasis added] The better your “likeability,” the less likely spigots open a path for water to flow and the drier you stay. That’s your prize for this game show (and hey, you also get the knowledge that people out there like you).
This system models a type of phase transition known as percolation.
The full post is here:

I highlighted above a key phrase “If it can find a path to the bottom, you get soaked.” What I didn’t say, but should have is that the water was being forced through the pipes, not just dropping down due to gravity. This is a very important point since our phases and phase transition changes dramatically if we just let gravity do the work. In the case of the water being “forced,” it can travel back up pipes if it helps it find its way out and onto your head, but in the case when only gravity is present, it falls down the pipes. To facilitate gravity, we’ll turn the pipes 45 degrees, and if we insert water at a single point on top, it could look like this:
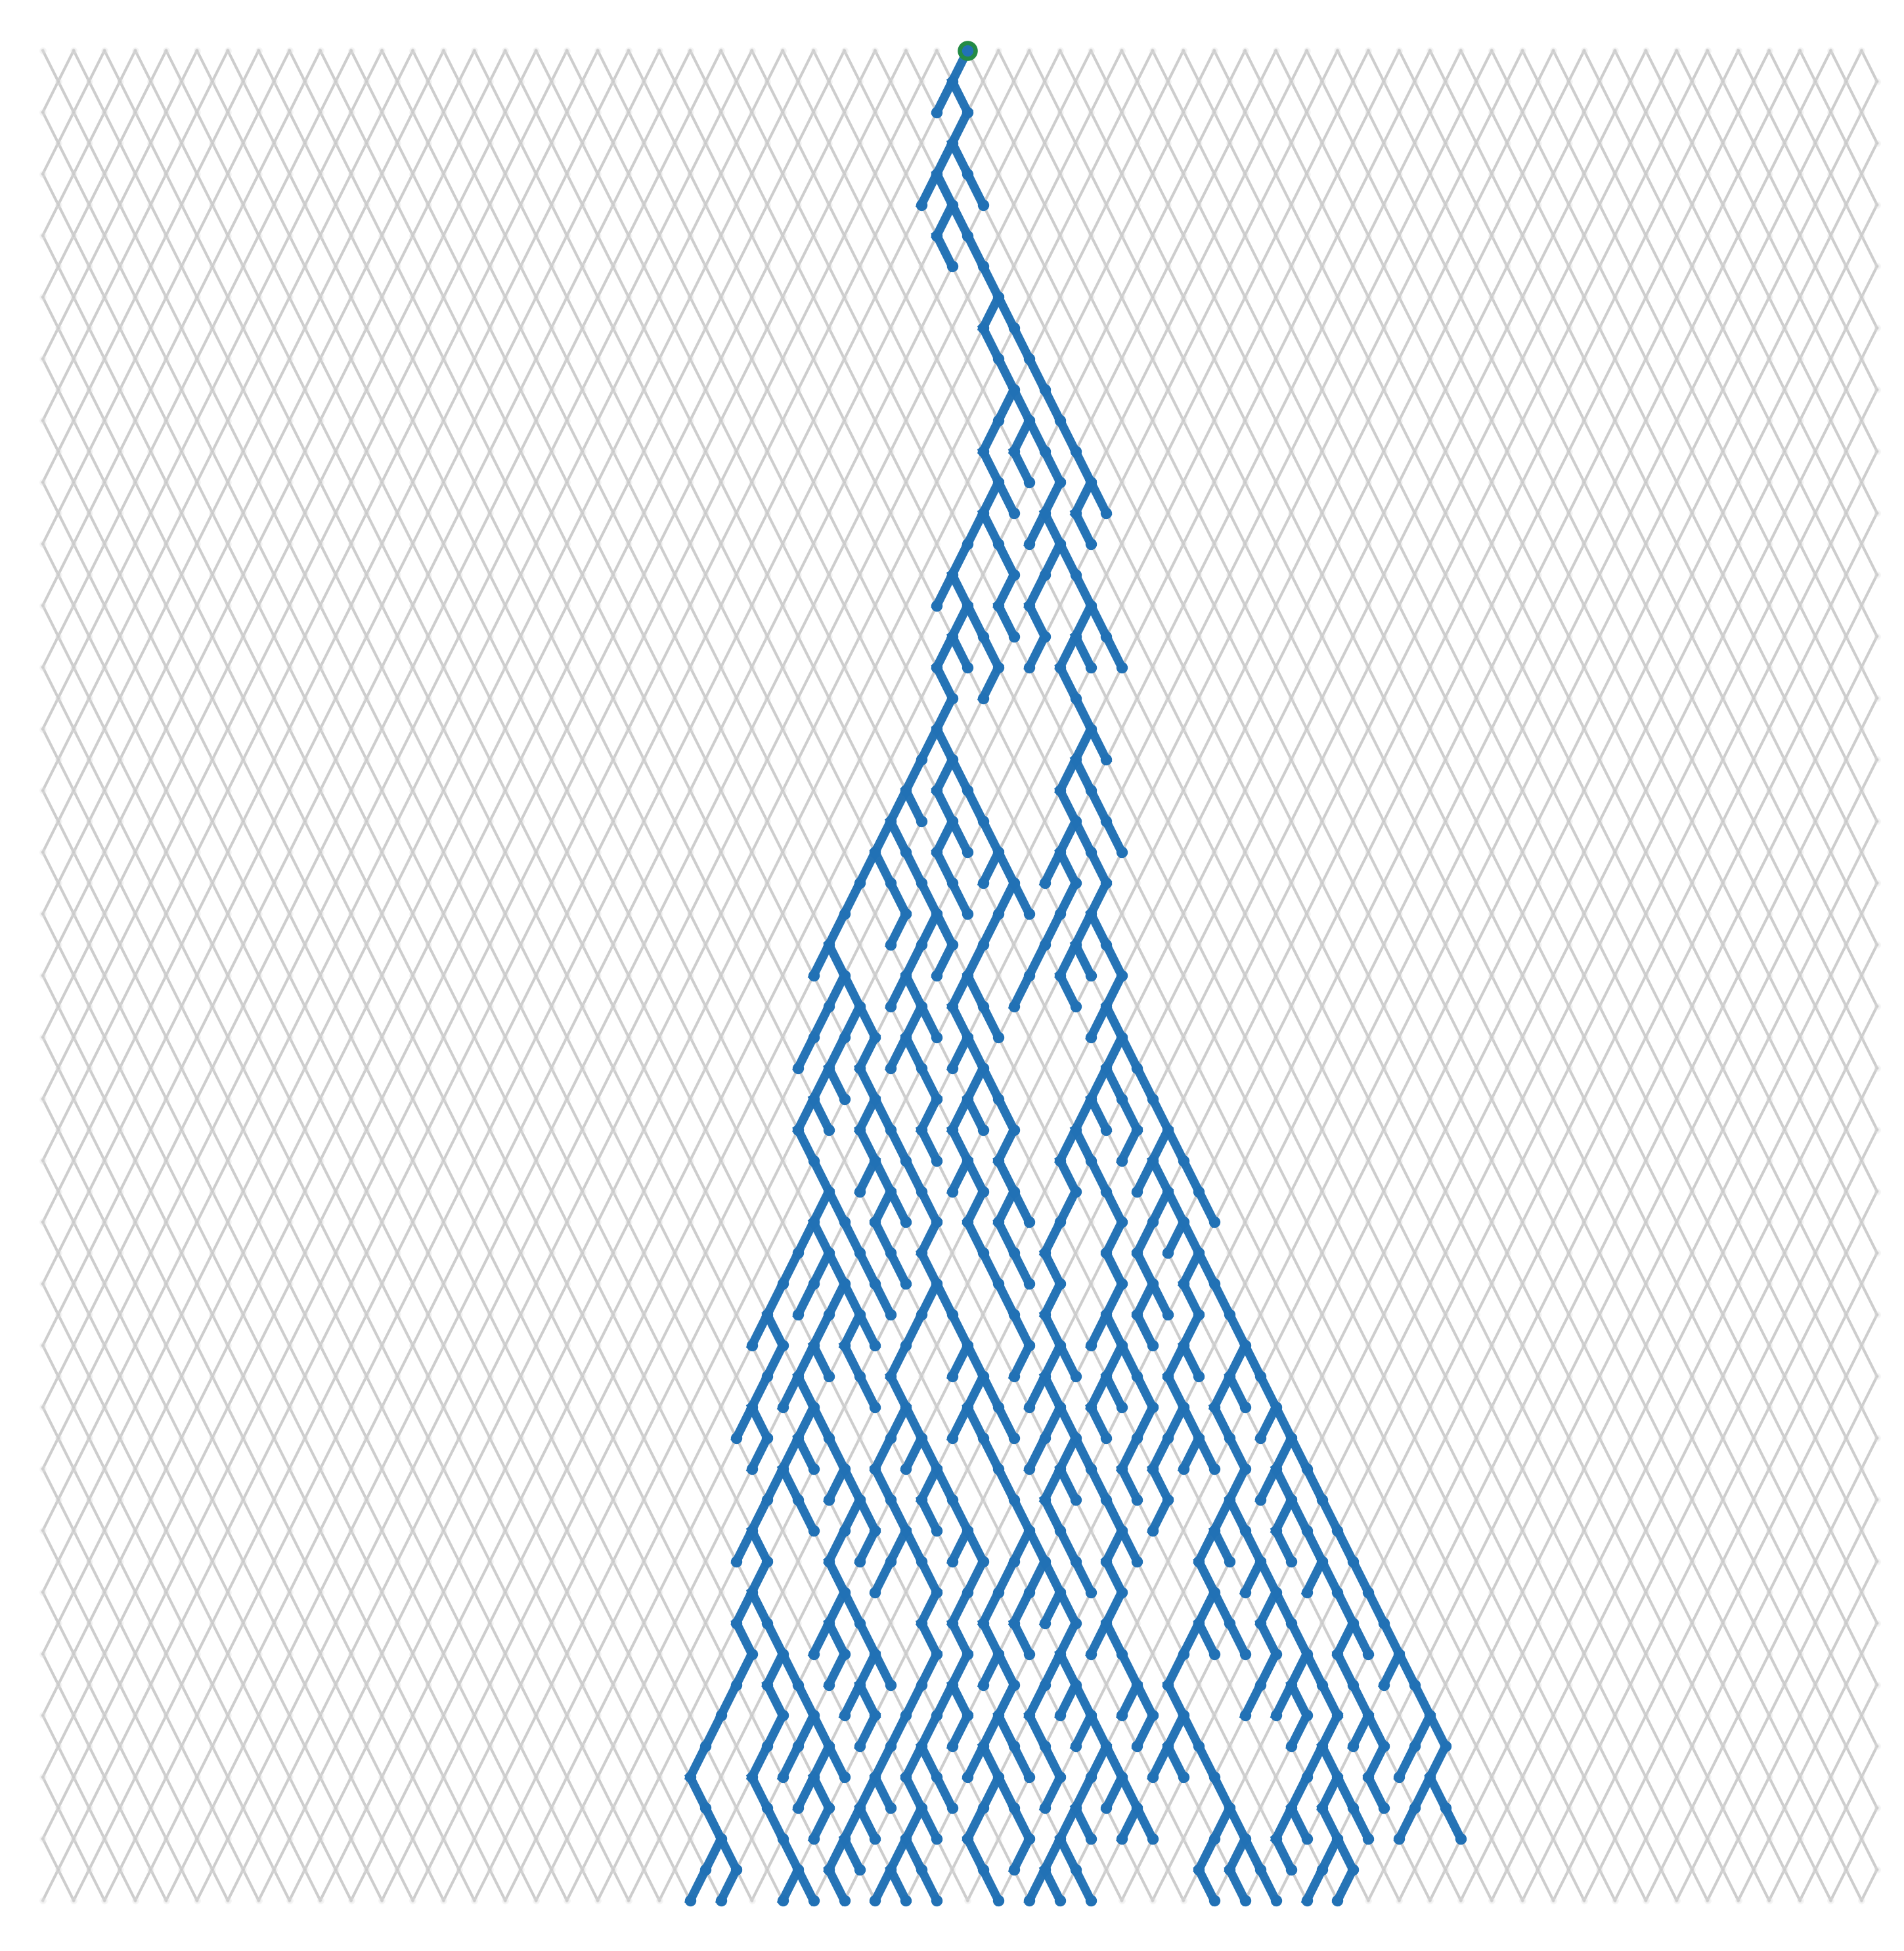
This setup is a different problem called directed percolation. It also has a phase transition, but one that is different in some fundamental ways from regular percolation.
Before we explore its stranger properties, we can ask, “At what likability threshold do you remain dry?” Well, this happens to have a transition chance of 35.53%!2 This system is a lot more generous, keeping you dry even when a majority of people dislike you. This number comes from numerical computations which have been done rather precisely, and we can even compute it ourselves. In fact, you can see this clearly with this plot
Notice that as we make the system bigger and bigger, the chance of getting soaked less than 35.53% increases and above it, it decreases. This is the same kind of hallmark of a phase transition as we saw in our previous case.
We can also look at the water as it flows down the system to see the clusters that make it from top to bottom
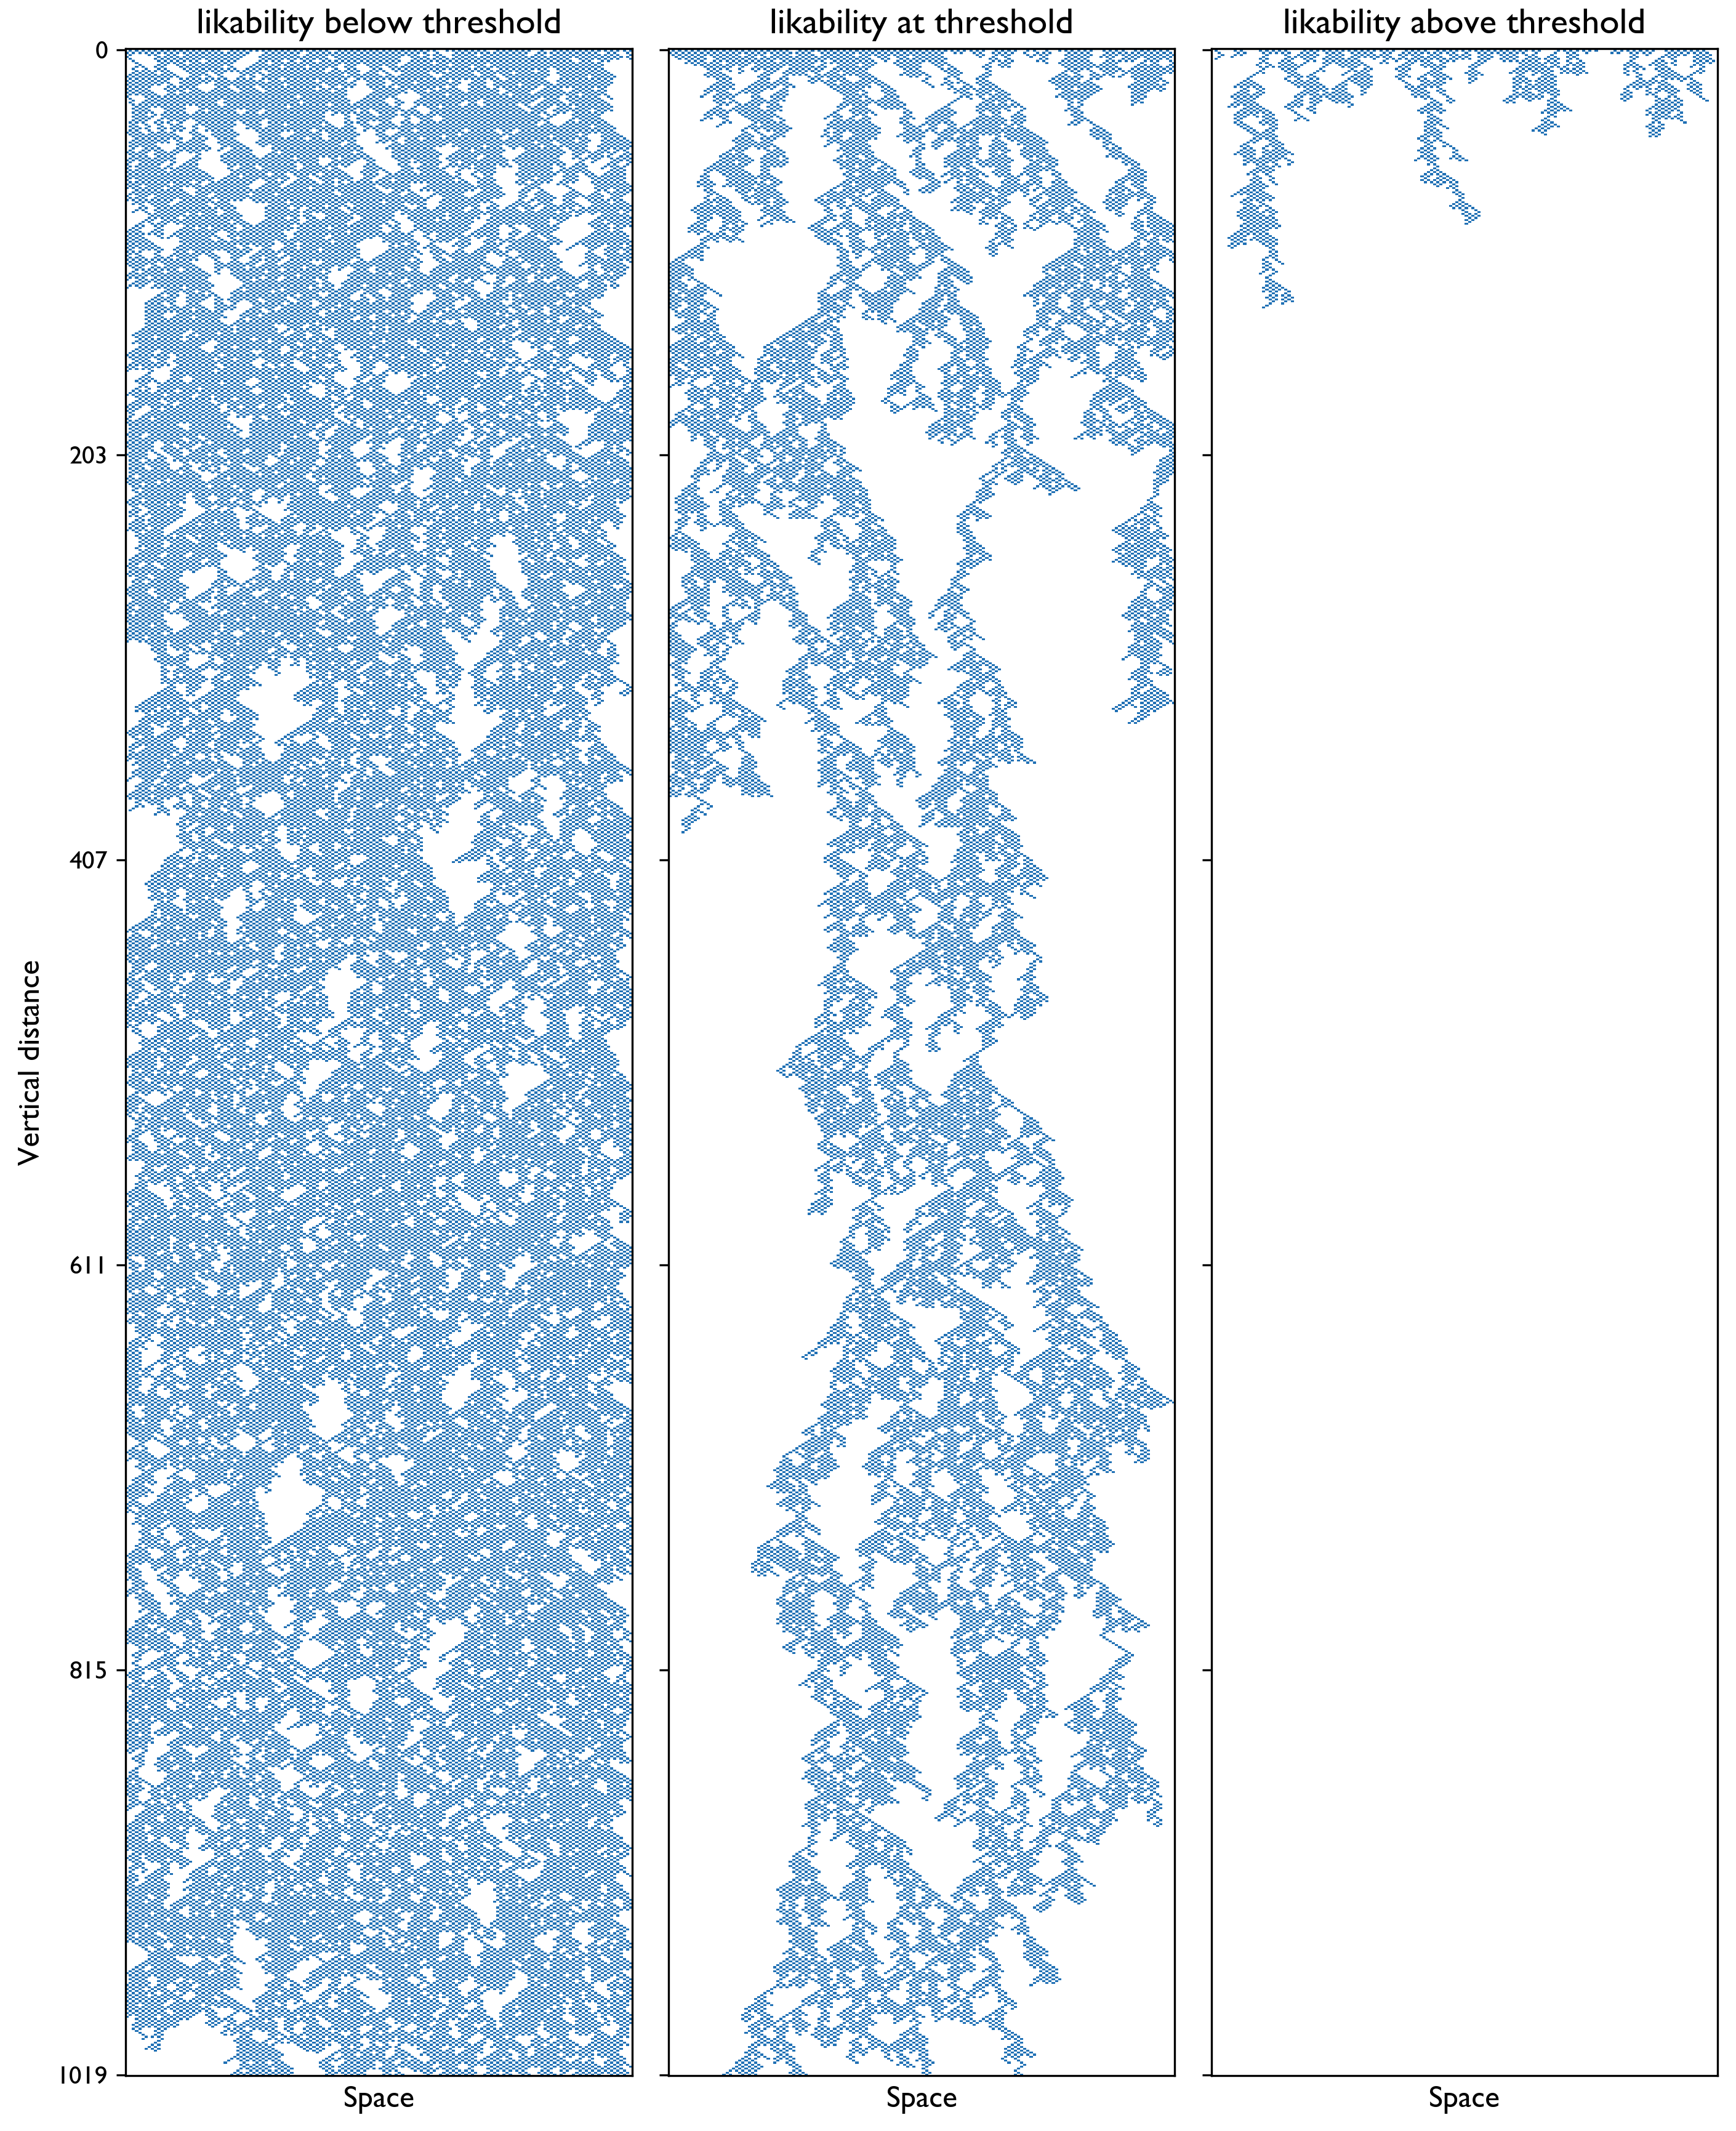
There is still a fractal-looking pattern at the transition point. With all of these similarities with the regular percolation problem from the last post, what is different? And why is that plot so long and skinny? If gravity wants to pull you down, is that somehow altering the motion down, making it distinct from the motion left or right?
Well, if you go back to the two plots above, you’ll notice a few things that really make them differ from the percolation plots. In the fine print of the first, I’ve noted that the vertical distance is L1.58, so for a horizontal size of 40, the vertical size is roughly 340! That is definitely not a square. And in the second plot, there appears to be more vertical distance than horizontal distance. What is special about this 1.58 number3? It turns out, it’s a critical exponent in this problem, a universal aspect of directed percolation, that distinguishes it from regular percolation. We will call it z = 1.58 the dynamical critical exponent since it is revealed as water flows down in time (dynamically). This dynamical exponent z can reveal itself by looking at these “long and skinny” setups, but be masked by the square setup.
Universality and the finite size of our system
One thing we took away in the previous post was that we lose any sense of scale at this type of phase transition4. But whenever we have “only” thousands of pipes, the size of the system provides a scale! This is the main reason why we begin to see smooth curves and not sharp jumps in quantities. If the system of pipes were infinite (and we had infinite time for the water to go down the pipes), the probability you get soaked would be 100% less than the 35.53% likeability and 0% more than 35.53% likeability. For physical systems, the finite size is often not a huge issue since the scale is closer to the 1023 atoms present in macroscopic systems, and so even things that are technically smooth curves look very sharp.
The problem of size becomes more severe with directed percolation because horizontal and vertical distances start behaving differently thanks to gravity. In this case, if we lay out our nice grid of 10 × 10, 20 × 20, or 30 × 30, we start to notice that the likeability threshold where you stop getting soaked, seems to depend on the size of the system more than before. In actuality it doesn’t, but for these small sizes, you are definitely getting soaked well into the so-called “Dry Phase” we previously labeled. This is seen in the red curves here where each bigger square has a curve underneath the last:
Gravity has done something to the system. Flowing down is different from flowing left or right. In fact, if we flow down by some amount h and over to the right by some distance w, then at the directed percolation transition point
The amount water flows down is related to how far it flows to the right or left by this weird, fractional power of w. This 1.58 is z, our new dynamical critical exponent, which is a universal feature of directed percolation5. It tells us that if we make a system 30 pipes wide, it should extend roughly 301.58 ≈ 216 pipes in height to begin picking out the phase transition effectively. The blue curves in the above plot show this and notice how they all converge on one point; that point is the phase transition. It is revealed by small sizes! To understand why, just think about how the curves are changing as we make the system bigger and bigger.
The red curves will still converge to the phase transition, but it takes larger system sizes for it to reveal itself. This is related to the property that at the phase transition there is no longer a sense of scale, but away from the transition, the vertical scale of clusters could be so large that our puny 60-by-60 grid cannot even begin to reveal it. So if we sit at say a likeability of 0.4 in the 60-by-60 grid, we can say that the vertical size of a typical cluster is most likely more than 60.
A different phase transition but connections to new types of physics
This “gravity mode” for our game show we may call “easy mode” since it requires less of the audience to like you, but the implications here are wide. This type of phase transition has been seen in many kinds of local dynamics where there is a preferred configuration or state. These called an absorbing state phase transitions, and they are a property of certain random dynamical systems. Gravity has provided the distinction here, but more generically, causality and time itself provide that direction, leading to dynamics that obey the same universality as directed percolation.
Trademark pending.
Usually, you’ll see 0.6447 quoted instead, but that’s just 1−0.3553, which counts open pipes instead of closed as we’re doing.
I should note that we have this number to much higher precision than the two decimal points presented here, see the Wikipedia entry where
This is a second-order or continuous phase transition. Most transitions in the water phase diagram are first-order transitions which still retain a scale.
To drive this point home: Even if we change the lattice, this power law will remain intact. Sometimes it shows up in completely different scenarios too, like in absorbing state phase transitions.