Scientists Discover a New Phase of Game Show!
How random votes, open pipes, and a splash of water give a glimpse into the physics of phase transitions.
You’ve seen the headlines: “Scientists Discover a New Phase of Matter!” They usually go something like, “You’ve heard of solids, liquids, and gases—but now there’s a fourth (fifth) phase: [insert buzzword here].”1 You might think about these phases in terms of temperature: heat up ice and it melts, a phase change! And yes, that is a phase transition. But temperature is just one knob we can turn, and phases are far richer than just “solid, liquid, and gas.” In fact, new phases are surprisingly common, and to understand why, let’s play a little game.
What is the Percolating Phase?
Imagine you’re on a game show called Are You Likeable? (the least-likeable game show). The rules of the game are simple:
You stand on the stage and try to win over the audience.
Each audience member votes whether they like you or not.
But the twist: votes aren’t tallied—they control a system of pipes above your head.
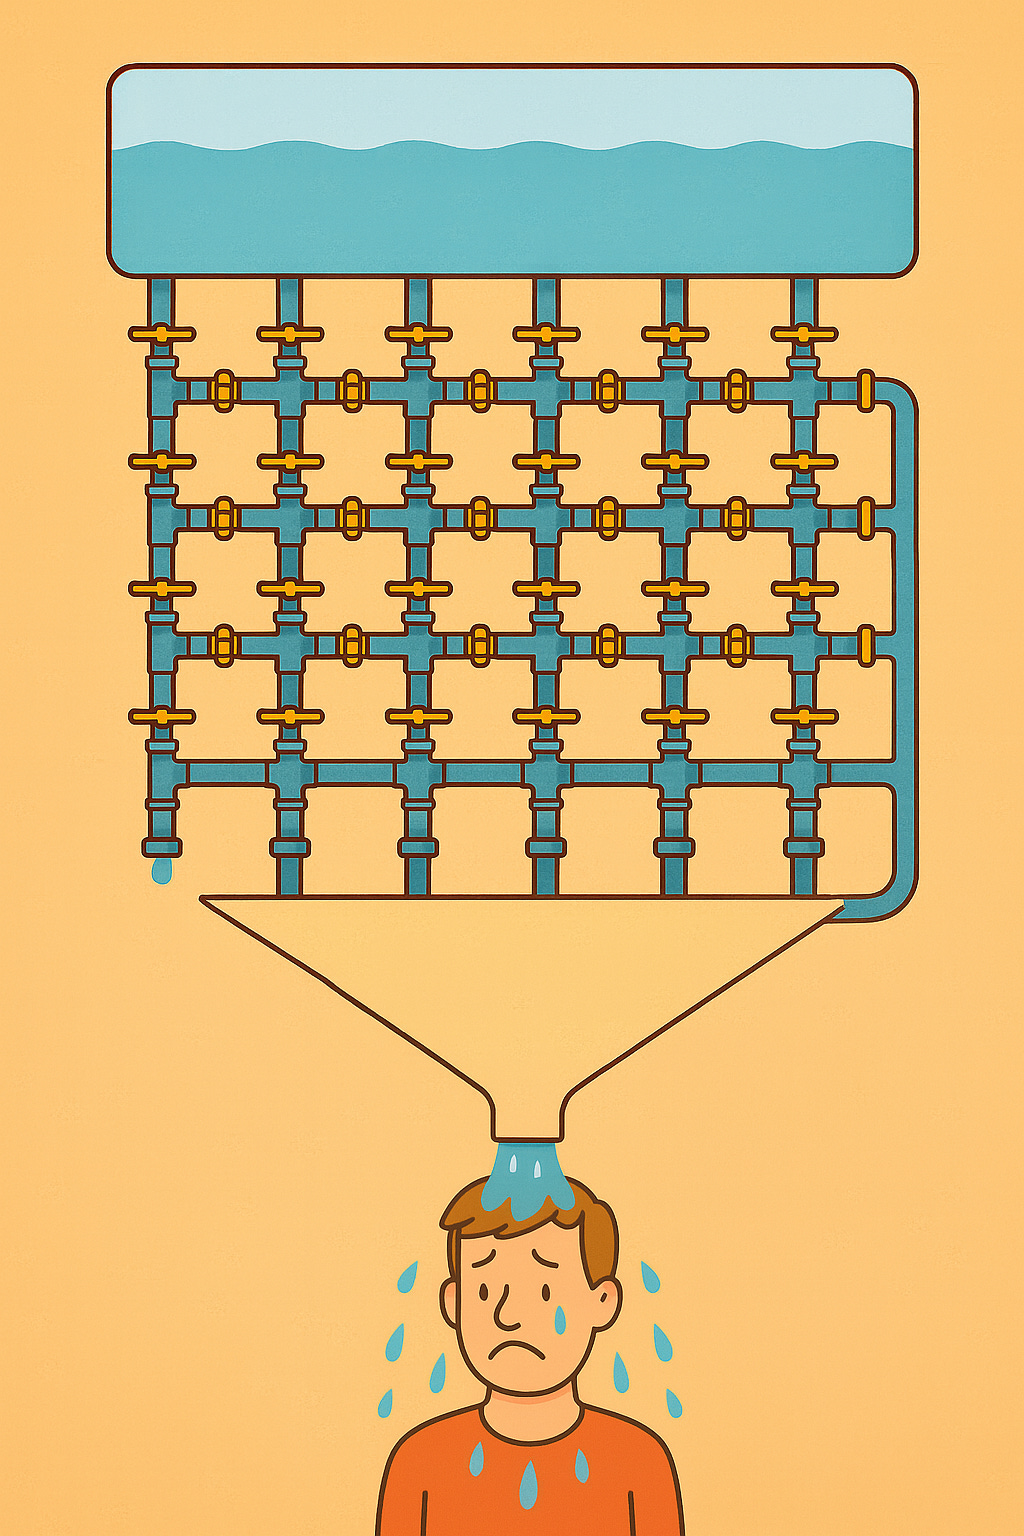
That system of pipes looks something like this2

Each “like” turns a spigot off, stopping water from flowing through one pipe in a grid overhead3. Once voting ends, water is dumped into the system. If it can find a path to the bottom, you get soaked. The better your “likeability,” the less likely spigots open a path for water to flow and the drier you stay. That’s your prize for this game show (and hey, you also get the knowledge that people out there like you).
This system models a type of phase transition known as percolation4.
But where is the phase transition?
Aside from asking when my game show will be green-lit5, we can ask: When are you most likely to get wet? If the audience is huge, and fewer than 50% of them like you, it’s nearly guaranteed that the water will find a path—you’ll be soaked. But if more than 50% like you, chances are good that you’ll stay dry.
This is a phase transition6: a sudden change in the system’s behavior. For a moderately sized audience, it looks something like this:

Your probability of getting soaked forms a curve that sharpens up with increasing audience size—becoming a near step at 50%. That is known as the percolation threshold.
This is hard to visualize, though; luckily this problem admits some very nice pictures. For instance, here is the problem with a large number of pipes:

If a pipe is blue, water is in it, and all the blue clusters flow down from the top. Notice what happens around 50%: even though spigots are randomly being turned off, the flow from top to bottom is entirely stopped around this value. Something is happening within the system that is allowing water to pass through on one side of the transition and not the other.
A closer look at the transition
To dig deeper, we simulate what happens at this threshold. Each spigot is either open or closed (randomly determined). If we visualize the grid (say 1024×1024 spigots), it looks like visual static: black and white dots with no obvious pattern7:
But now let’s color each connected cluster of open spigots—where water could flow and fill up this section of pipes. Suddenly, structure emerges. Some clusters are small, others large. If one spans from top to bottom, water flows and we’re in the percolating phase. If not, we’re in the non-percolating phase. At the transition (within the static above, we get this for the twelve largest clusters:
At exactly the percolation threshold (50% for the pipes above), there’s no single dominant cluster, but also no clear typical size. Instead, there’s a wide distribution of cluster sizes. The critical state behaves differently than either phase.
Scale Invariance: A Hallmark of Criticality
Let’s zoom out. Suppose we double the grid to 2048×2048.
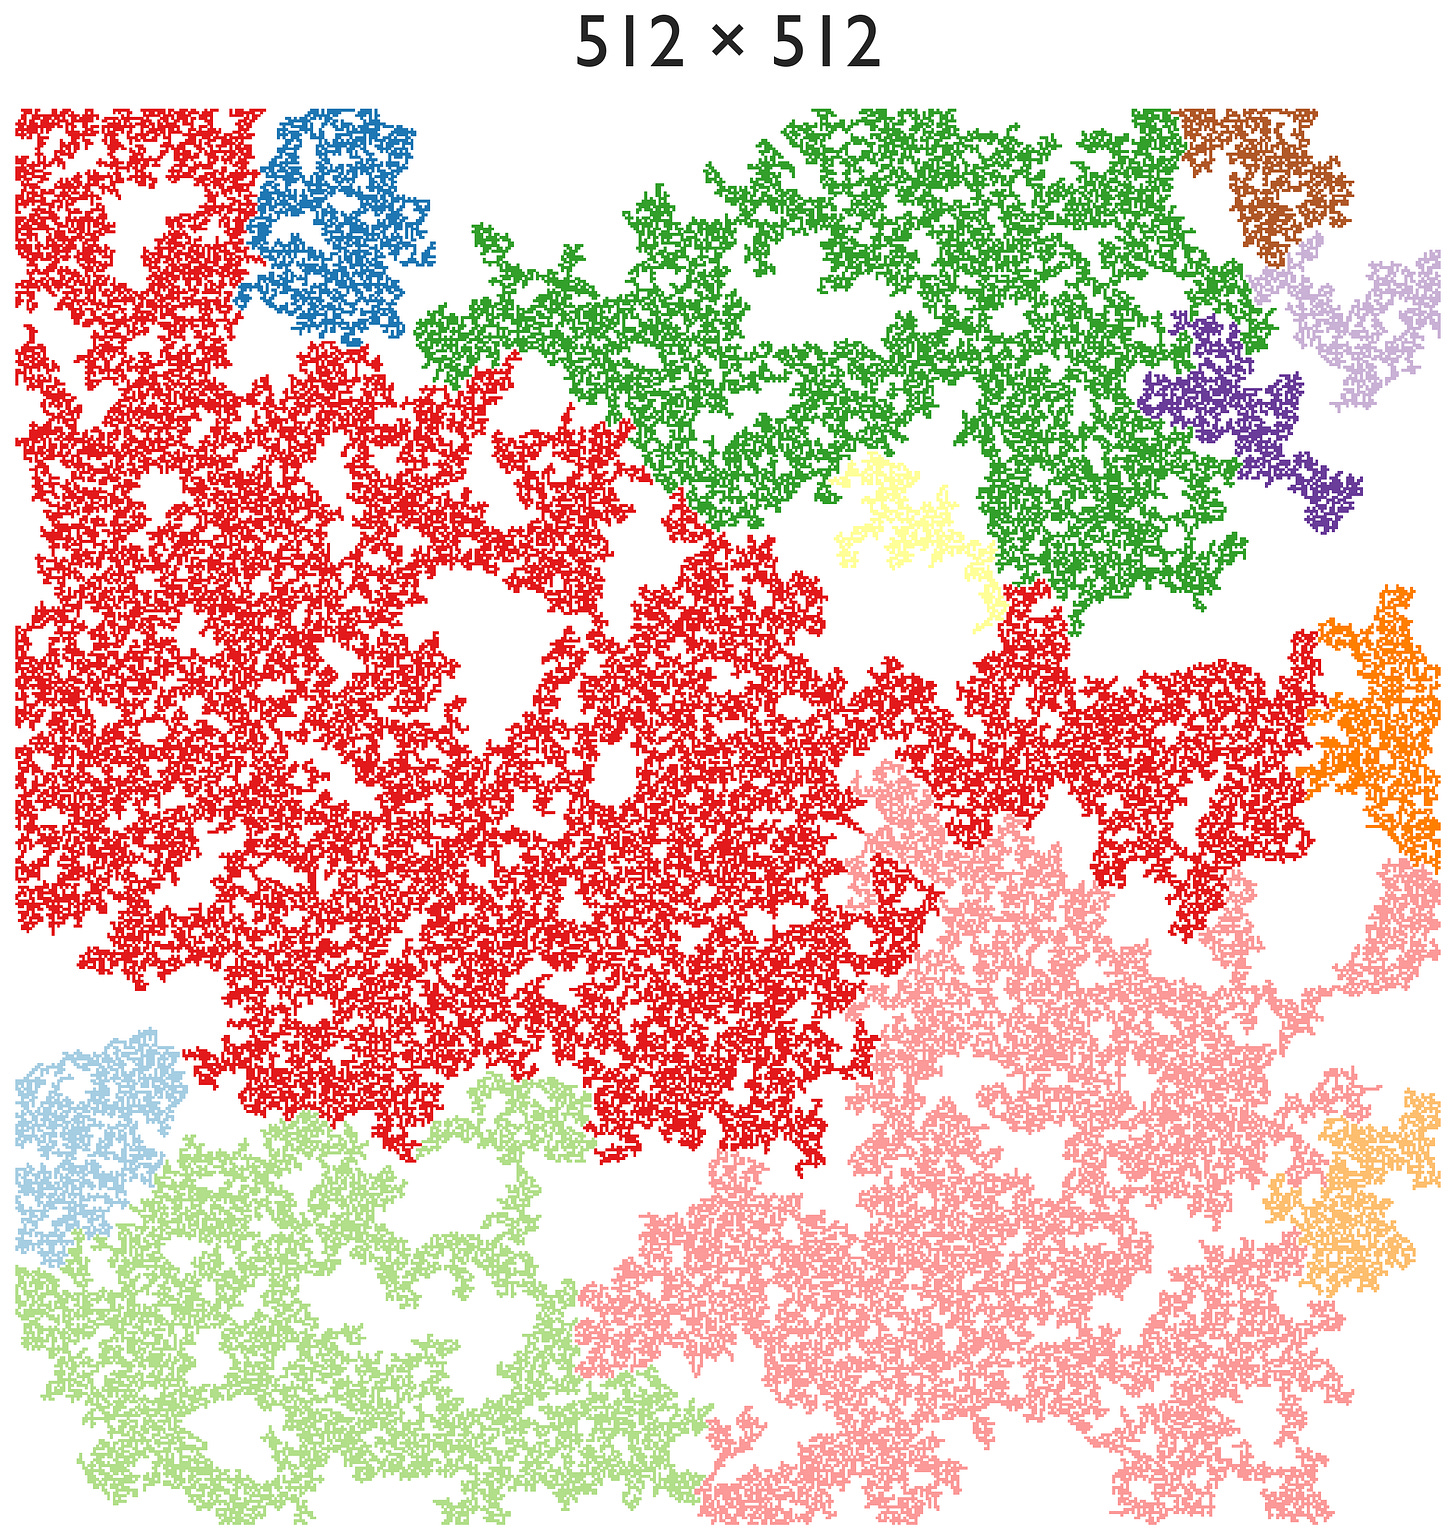
The largest clusters are definitely larger—the largest here is 400,000 pipes/spigots large, while for the previous 1024×1024 case the largest was 180,000 large—but the pattern still looks… the same. We doubled the size, but if we slightly blur our vision, we cannot distinguish these two plots (even though one is quadruple the area of the other). Look at 512×512—even that looks similar:
You would be hard-pressed to say which one is larger if you blurred your eyes. This problem is apparent even down to 256×256 or 128×128.
This is called scale invariance—there is no characteristic length scale at the phase transition. It’s one of the defining features of what are known as second-order phase transitions.
It also explains why, at the threshold, you have a 50% chance of getting soaked. The largest cluster might span the system, but it might just as well fall short. There’s no guarantee either way.
Fractals in the Flow
These clusters within the above pictures don’t look like regular 2D structures or even 1D lines; they are, in fact, fractals. They aren’t exactly self-similar but they do behave the same at different scales. They fill space with a fractal dimension: not quite 1D, not quite 2D. In two-dimensional percolation, the clusters have a dimension of 91/48 ≈ 1.896—a universal number shared by all systems in this class, regardless of lattice type or other microscopic details.
This is part of the beauty of percolation: It shows us visually the underlying mathematical structure and even reveals some universality of phase transitions.
Why This Matters
Percolation is just one example, but it captures the essence of what physicists mean when they talk about “phases of matter.” It isn’t always about exotic particles or extreme temperatures turning gas into plasma. Sometimes, it’s about whether a liquid can find its way through a series of pipes. It’s about symmetry, structure, and emergence.
You’ve experienced water’s phases: ice, liquid, steam. But nature offers many more—some with no neat label like “solid” or “gas.” The theory of phase transitions explains them. Percolation is a window into that wider world.
What’s funny to me about this is how we use ice/water/vapor to expound on this. But water’s phase diagram is complex and deserves its own post. One point of interest: water and water vapor can be smoothly connected to each other without going through any phase transition. That and there’s something like 20 phases of ice.
Forgive me the ChatGPT weirdness: the drip on the left pipe and the weird long pipe on the right are just LLM quirks. Kind of like how hard it is to get AI to draw a full wine glass. (Or maybe now it can?)
Audience members can’t influence each other here. Assume the spigots are randomized and a stern librarian keeps everyone silent.
Technically, this is bond percolation on a square lattice.
NBC, call me!
A second-order phase transition is one where the change is continuous, but its derivatives (like heat capacity or cluster size) diverge. Percolation is a particularly visually clean example.
I have switched from bond percolation to site percolation to make plotting and cluster finding easier. The universal features do not depend on this.


